RUM “Light” with CloudFlare and Google Analytics
Notice: This article is more than 10 years old. It might be outdated.
Would you like to know the ratio of visitors accessing your website over IPv4 vs. IPv6? Or curious about how many visitors you serve over HTTP/2 vs. SPDY or HTTP 1.1?
Using Google Analytics, CloudFlare and some JavaScript magic we can easily get answers to these questions. For this we will use the principle of Real User Monitoring (RUM).
In a previous post I’ve already shown how we can track the usage of CloudFlare data centers for the delivery of our website in Google Analytics. In this blog post I want to show you how to refine this method even further and also include information about other interesting metrics, such as IPv6 and HTTP/2 usage .
Possible custom dimensions
In the previous post I used response header information, presented by the CloudFlare edge servers to extract information about the served traffic.
This time we will instead use a special debugging URL that is available for all CloudFlare powered sites. It is available under https://www.example.com/cdn-cgi/trace, where https://www.example.com/ corresponds to the CloudFlare powered domain.
The result will look like this:
fl=4f96
h=www.cloudflare.com
ip=2606:4700:1000:8200:7847:642:dc8e:b176
ts=1454615047.969
visit_scheme=https
uag=Mozilla/5.0 (Windows NT 6.3; Win64; x64) AppleWebKit/537.36 (KHTML, like Gecko) Chrome/48.0.2564.103 Safari/537.36
colo=SJC
spdy=h2
loc=US
Let’s have a closer look at the fields that are interesting to us and what they mean:
- ip: This lists the IP address that was used to contact CloudFlare for this request. We can use this value to determine whether the request was made over IPv4 or IPv6.
- visit_scheme: This will tell you whether the request was made over HTTP or HTTPS. In case you serve traffic only over HTTPS, this is rather not interesting. Otherwise you could use it to determine the traffic split between visitor using an encrypted vs. un-encrypted connection.
- colo: The CloudFlare Points-of-Presence (PoP), which served this traffic. In the previous post you have already seen how to use this.
- spdy: The HTTP protocol version that was used to serve this content. Even though the key is called “spdy”, the value can also indicate HTTP/2 via “h2” (as depicted above). A value of “3.1” will indicate SPDY/3.1 and “off” will indicate HTTP 1.x. It would make more sense to have the field “http” available with ”http=h2” for HTTP/2, ”http=spdy/3.1” for SPDY/3.1, and ”http=http/1.x” for HTTP/1.x. But for now the “spdy” field is good enough.
- loc: The country that CloudFlare located the visitor in. This information is already available in Google Analytics, we therefore do not need to extract it here.
How does Real User Monitoring fit into the picture?
Now that we know about all this great data at /cdn-cgi/trace for our website, how can we make this accessible in Google Analytics? Especially while keeping in mind, that this data is only available for the current connection and differs from user to user.
The trick: We make the user download the data, extract the values and push the results into Google Analytics.
This approach of leveraging a real user to measure or monitor something is called Real User Monitoring or RUM for short.
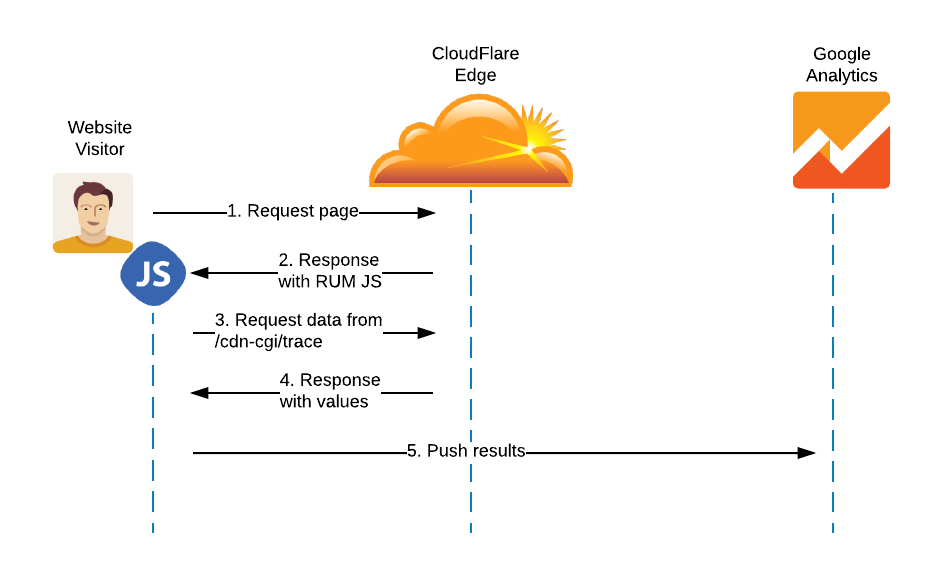
The workflow that will be execute on every page load is as follows (See Figure 1):
- Step 1: A user requests a page via his or her browser.
- Step 2: The content is returned and includes a JavaScript to be executed by the browser.
- Step 3: The JavaScript requests the content from /cdn-cgi/trace.
- Step 4: The different values for that particular visitor and browsing session are returned to the JavaScript.
- Step 5: The JavaScript pushes the values as custom dimension into Google Analytics.
The additional request of the browser to /cdn-cgi/trace is similar to the browser loading stylesheets or images for rendering a page. This added round-trip to the closest CloudFlare edge for one more element does not impact the performance of the site.
Create custom dimensiosn in Google Analytics
For each value from /cdn-cgi/trace that we want to track, we need to create a custom dimension in Google Analytics. Here is an example mapping for the values that we want to track in this blog post:
- dimension1: CloudFlare PoP location
- dimension2: Access Scheme (HTTPS vs. HTTP)
- dimension3: IP Transport Method (IPv4 vs. IPv6)
- dimension4: HTTP version (HTTP 1.1 vs. SPDY vs. HTTP/2)
First, set up the custom dimensions in Google Analytics:
- Sign in to Google Analytics.
- Select the Admin tab and navigate to the property to which you want to add custom dimensions.
- In the Property column, click Custom Definitions, then click Custom Dimensions.
- Click New Custom Dimension.
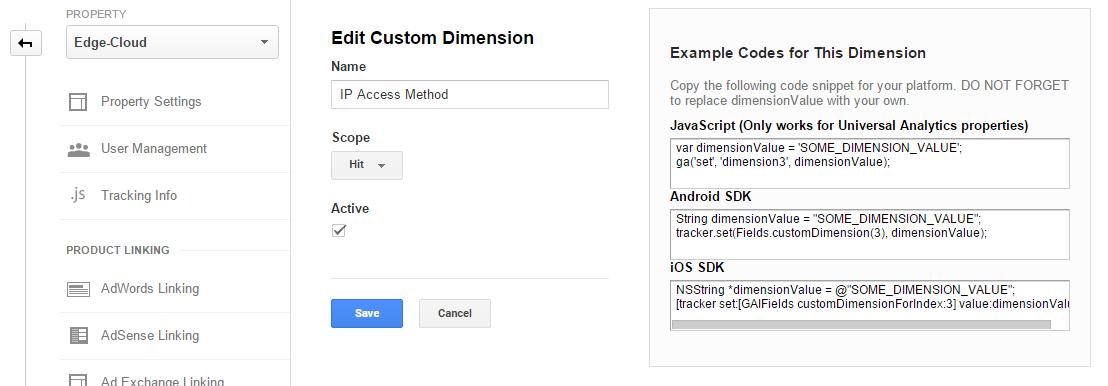
- Add a Name. This can be any string, but use something unique so it’s not confused with any other dimension or metric in your reports. Only you will see this name in the Google Analytics page.
- Select the Scope. Choose to track at the Hit, Session, User, or Product level. For this scenario I recommend to choose Hit or rather Session.
- Check the Active box to start collecting data and see the dimension in your reports right away. To create the dimension but have it remain inactive, uncheck the box.
- Click Create.
- Note down the dimension ID from the displayed example codes. In the example for this blog post the dimension IDs are listed above for the three monitored values.
Embed the Google Analytics Tracking Code
Next we need to embed the Google Analytics tracking code within the website, in order to fill the newly created custom dimensions with data. This tracking code has to be placed between the code for creating the Google Analytics tracker, which looks like this: __gaTracker('create','UA-12345678-1','auto');, and the code to submit the tracker, which looks like this __gaTracker('send','pageview');.
If you are using WordPress the easiest way to include the custom tracking code is by using the “Google Analytics by Yoast” plugin. This plugin allows you under Advanced > Custom Code to embed the below code right away and without any coding requirements.
The below JavaScript code will read the values from /cdn-cgi/trace, extract the information we are interested it and push it into the Google Analytics custom dimension variables. Ensure that the numeric IDs of these custom dimension variables matches what you have created in above steps.
    function processData(x) {
      var y = {};
      for (var i = 0; i < x.length-1; i++) {
        var split = x[i].split('=');
        y[split[0].trim()] = split[1].trim();
      }
      return y;
    }

    function objData(x) {
      return obj[x];
    }

    function isIPv6() {
      ipv6 = (objData('ip').indexOf(":") > -1);
      switch (ipv6){
        case true:
          return "IPv6";
          break;
        default:
          return "IPv4";
      }
    }

    var data;
    var obj;
    var client = new XMLHttpRequest();
    client.open("GET", "/cdn-cgi/trace", false);
    client.onreadystatechange =
            function () {
                    if(client.readyState === 4){
                            if(client.status === 200 || client.status == 0){
                                    data = client.responseText.split("\n");
                            }
                    }
            };
    client.send(null);
    obj= processData(data);

    __gaTracker('set','dimension1',objData('colo'));
    __gaTracker('set','dimension2',isIPv6());
    __gaTracker('set','dimension3',objData('spdy'));
Embedded in your website along with the standard Google Analytics tracking code, this custom JavaScript code will be executed by a visitor, collect metrics data from /cdn-cgi/trace and push it into Google Analytics.
A few hours after embedding the code you should see your first custom dimension data in Google Analytics.
Create custom reports in Google Analytics
You can now create custom reports with the custom dimensions in Google Analytics. A simple example would be to determine the IPv4 vs. IPv6 traffic ratio.
- Make sure you are still signed in to Google Analytics.
- Select the Customization tab and click on New Custom Report.
- Name your Custom Report here.
- Select a Metric for which you want to see your Custom Dimensions. I recommend the metric “Sessions” within the “Users” Metric Group.
- Next select the custom dimension for the IP Transport Method (IPv4 vs. IPv6), that you created as the “Dimension Drilldown” (See Figure 3).
- Click on the Save button.
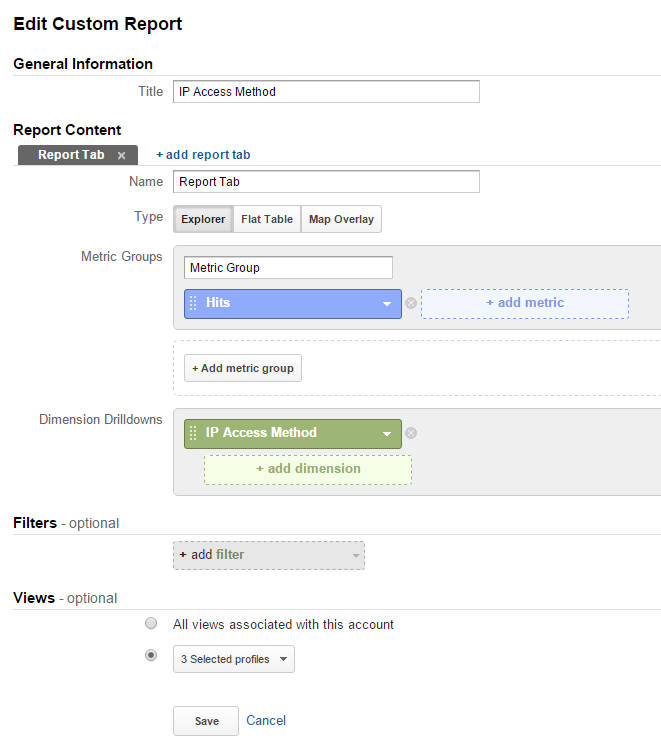
The resulting Custom Report will show you how many session - in total numbers, but also in percent - were served by which transport method.
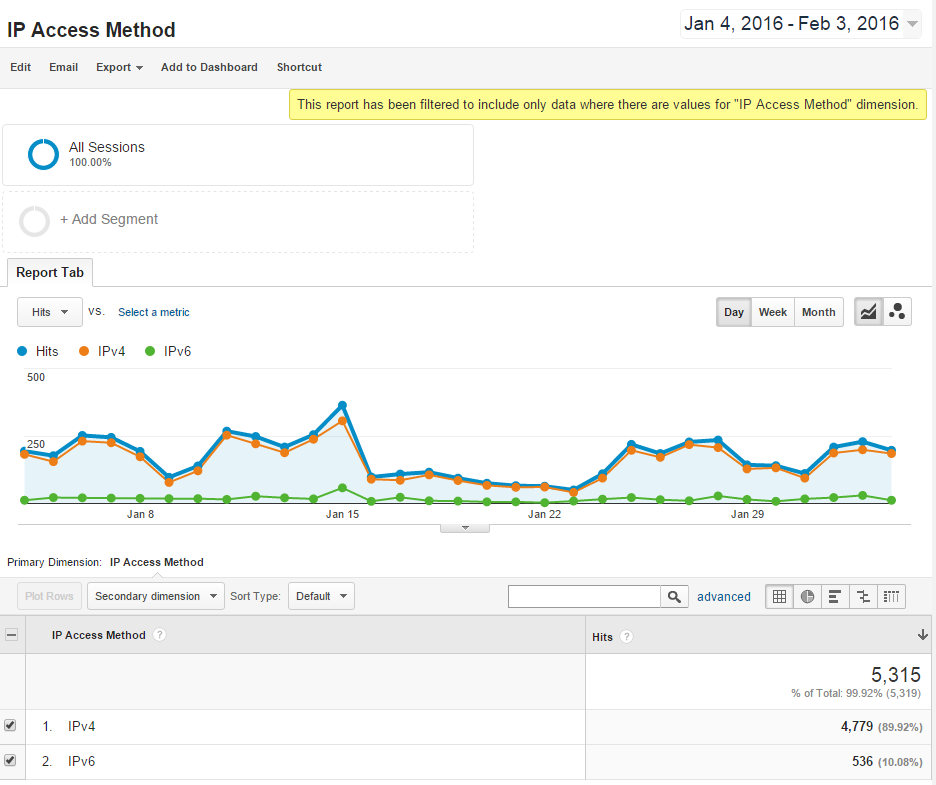
You can generate similar graphs for the other custom dimensions. E.g. in order to find out how much of your web-sites traffic was served over HTTP/2 (See Figure 5).
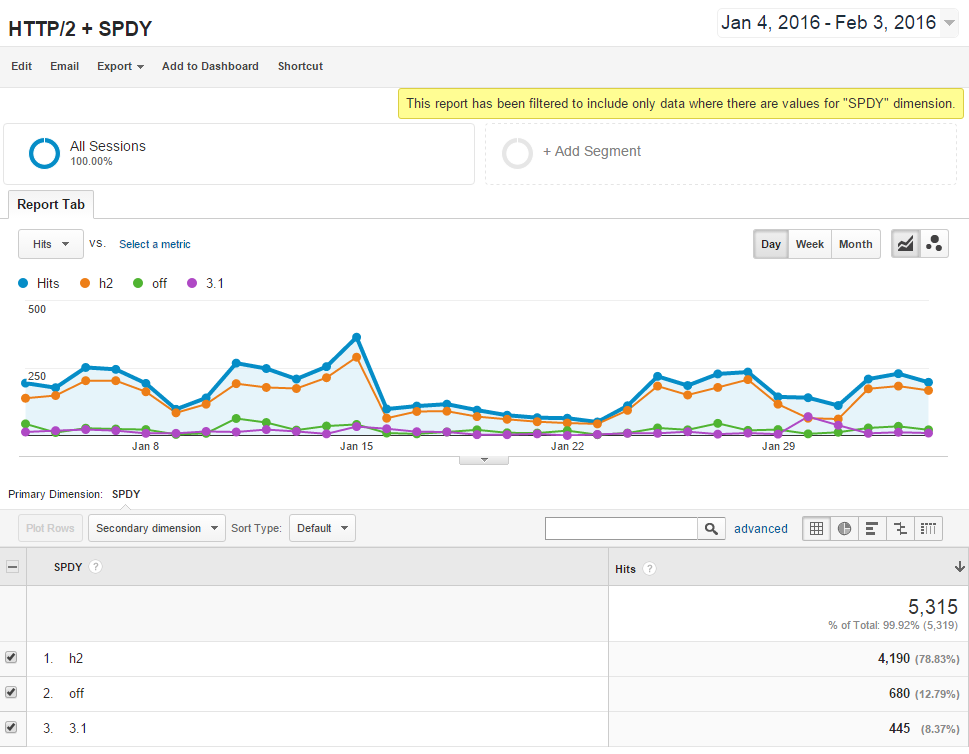
By combining data from the custom dimension with data collected by Google Analytcis natively you can answer many interesting questions for your website, such as: Is IPv6 traffic really mostly driven by mobile traffic? Where are all these users with HTTP/2 capable browsers located?
Summary
This article has shown you, that you can easily built your own Real User Monitoring system with Google Analytics Custom dimension and some JavaScript code. It allows you to extract many interesting metrics out of your CloudFlare usage and make it available in Google Analytics for further data analysis.
Not only has this site been using the above described method since November 2015, but also another HTTP/2 adoption, which has provided interesting insights into the HTTP/2 adoption.

Leave a comment