Network troubleshooting via Arista EOS shell
Notice: This article is more than 11 years old. It might be outdated.
A few days ago the startup Cumulus Networks emerged from the clouds with their Cumulus Linux OS for original design manufacturer (ODM) switches based on Broadcom silicon. While the average customer will have to wait a while to get their hands on a Cumulus Networks based device, users of Arista switches can already today use the benefits of a full Linux distribution running on a data center switch.
Arista EOS is based on a Linux kernel and provides full and open access to a Linux shell, allowing installation and use of Linux based management and troubleshooting tools.
In this short post I want to show you two use cases where this capability comes in extremely handy in the daily network management work: Network Troubleshooting.
TCPDump to PCAP
Quite frequently it happens that network devices aren’t behaving the way they should be. Let’s take the example of a virtual router that doesn’t want to form OSPFv3 adjacency with the core switch. What usually helps quite a bit are packet captures of the traffic between the involved network devices. In the past it could be quite challenging acquiring these packet captures, requiring the setup of a Switched Port Analyzer (SPAN) Remote Switched Port Analyzer (RSPAN) or even Encapsulated Remote Switched Port Analyzer (ERSPAN).
With Arista EOS it becomes much easier, as you can run TCPDump directly on the switch to capture a PCAP file for Wireshark:
First, change into the EOS shell from the priviliged CLI mode:
ams-core01a#bash

Arista Networks EOS shell

[user@ams-core01a ~]$
Next, start the pre-installed tcpdump in PCAP capturing mode on the desired interface. Here I run it on the VLAN interface vlan51 and capture the file into the flash. Once you’re done with the packet capture, press Ctrl + C to abort tcpdump:
[user@ams-core01a ~]$ tcpdump -i vlan51 -s 65535 -w /mnt/flash/int-vlan51.pcap
tcpdump: listening on vlan51, link-type EN10MB (Ethernet), capture size 65535 bytes
^C10 packets captured
10 packets received by filter
0 packets dropped by kernel
[user@ams-core01a ~]$
Next we copy the files to another host - here a NOC jumpbox - to open it in Wireshark. That can easily be done via the installed SSH SCP client:
[user@ams-core01a ~]$ scp /mnt/flash/int-vlan51.pcap root@noc01.edge-cloud.net:/tmp
The authenticity of host 'noc01.edge-cloud.net (2a01:4f8:d12:11c4::2)' can't be established.
RSA key fingerprint is df:6c:9d:dd:8f:45:f8:61:96:0f:e4:54:c9:2d:d3:94.
Are you sure you want to continue connecting (yes/no)? yes
Warning: Permanently added 'noc01.edge-cloud.net,2a01:4f8:d12:11c4::2' (RSA) to the list of known hosts.
Yubikey for 'root':
int-vlan51.pcap                               100%  910     0.9KB/s   00:00
[user@ams-core01a ~]$
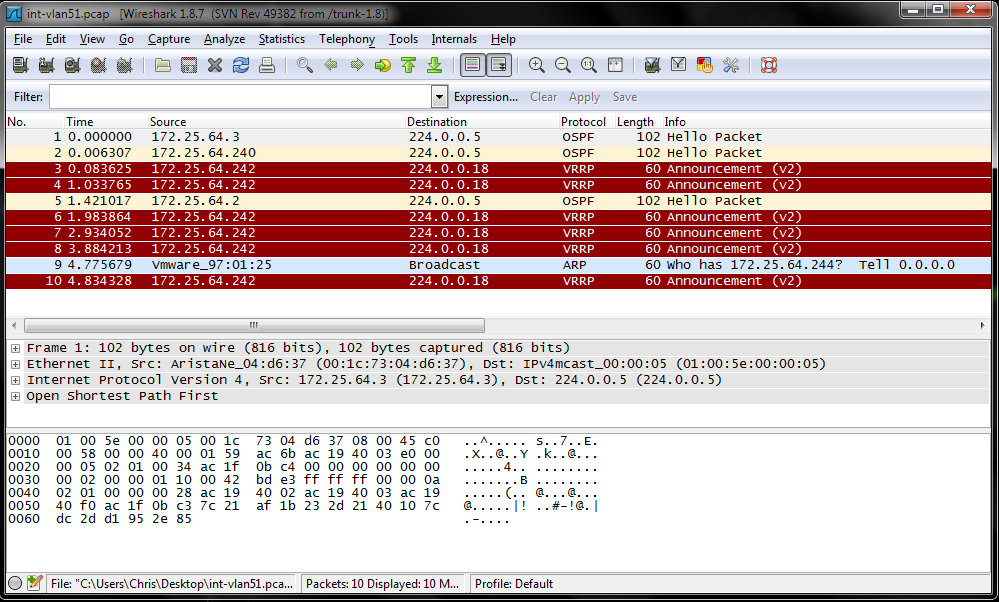
The capture PCAP file can be opened directly in Wireshark as shown in Figure 1:
Throughput testing with iperf
In the previous blog post Measuring Network Throughput, I already showcased how to use iperf to measure the TCP throughput between two hosts. The good news: Arista EOS has iperf pre-installed. You can therefore use an Arista device to perform network throughput tests for TCP and UDP.
Let’s have a look: If you are not yet in the EOS shell mode, change into it from the priviliged CLI mode:
ams-core01a#bash

Arista Networks EOS shell

[user@ams-core01a ~]$
By default iperf uses the port TCP/5001 in server mode for inbound connections. But Arista blocks this port by default. Therefore you have to temporarily add an iptables rule in the EOS shell to allow access to port TCP/5001. This is done with the command:
[user@ams-core01a ~]$ sudo iptables -I INPUT -p tcp -m tcp --dport 5001 -j ACCEPT
It can later be undone via:
[user@ams-core01a ~]$ sudo iptables -D INPUT -p tcp -m tcp --dport 5001 -j ACCEPT
Also keep in mind, that this command will not survive a reboot of the switch. Next you have the option to run iperf either in server or client mode.
iperf Server mode
Press Ctrl + C to exit the server mode.
[user@las-core01a ~]$ iperf -s
------------------------------------------------------------
Server listening on TCP port 5001
TCP window size: 85.3 KByte (default)
------------------------------------------------------------
[  4] local 172.31.3.4 port 5001 connected with 172.31.1.2 port 44589
[ ID] Interval       Transfer     Bandwidth
[  4]  0.0-10.3 sec  89.6 MBytes  72.9 Mbits/sec
^C[user@las-core01a ~]$
iperf Client Mode
[user@ams-core01a ~]$ iperf -c las-core01a.edge-cloud.net
------------------------------------------------------------
Client connecting to las-core01a.edge-cloud.net, TCP port 5001
TCP window size: 16.0 KByte (default)
------------------------------------------------------------
[  3] local 172.31.3.4 port 60088 connected with 172.31.1.2 port 5001
[ ID] Interval       Transfer     Bandwidth
[  3]  0.0-10.0 sec  63.0 MBytes  52.7 Mbits/sec
[user@ams-core01a ~]$
If you read the blog post Measuring Network Throughput, you will remember that TCP throughput depends on the link latency and the TCP window size.
In the above example we didn’t specify the TCP window size, but used the standard Linux auto-tuning TCP buffer limit. Here Arista has already done some tuning for us and set this auto-tuning TCP buffer limit to 4096 KByte.
[user@ams-core01a ~]$ cat /proc/sys/net/ipv4/tcp_rmem
4096    87380   4194304
[user@ams-core01a ~]$
That should be more than sufficient for most TCP performance test, even across WANs.
Outlook
This was just a simple example on how to use the Arista EOS shell in daily network operations. In the end the Linux powered EOS shell gives almost endless opportunities for usage. What would you use it for?
Leave a comment